AI’s Electricity Demand Is Becoming a Product-Design Problem
The IEA projects data-centre electricity use to rise from 415 TWh in 2024 to about 945 TWh by 2030. Those system-wide figures do not measure energy per AI request.
Key takeaways
- The IEA’s figures describe global data-centre electricity use, not an AI-only or per-request total. [@iea-energy-ai-executive-summary]
- Routing and model choice should be tested against task quality and service cost.
- Measure the complete path to a successful outcome rather than inferring product energy from a global forecast.
In this article
The bottom line
The IEA projects data-centre electricity demand to rise from 415 TWh in 2024 to about 945 TWh by 2030; that is not an energy-per-request estimate. [1] Global infrastructure forecasts explain the scale of the constraint, while product teams still need local measurements of successful work, latency, cost and energy.
A material signal, with a clear boundary
The International Energy Agency’s Energy and AI report says data centres used 415 TWh of electricity in 2024, around 1.5% of global electricity use, and projects roughly 945 TWh by 2030. It identifies AI as the leading driver of growth alongside other digital services. These are global data-centre figures, not an AI-only inventory or a measurement of one model call. [1]
The forecast matters because electricity, cooling and grid access place physical limits around digital services. But it cannot be divided into a product’s requests to produce an energy-per-query estimate: the source does not supply that denominator. Keep the projection, its horizon and its system boundary together when using it to explain the design challenge. [1]
A global total cannot price a feature
The IEA forecast describes electricity demand across data centres, which host AI and non-AI workloads. It is evidence of infrastructure scale, not a direct measure of the energy used by a particular chatbot, model, application or request. Regional mix, hardware, utilisation, cooling and workload all affect what a product consumes, and the executive summary does not resolve those factors for individual services. [1]
A product team still needs a local cost model. It can measure energy or provider-reported usage where available, alongside latency, retries, successful outcomes and human review. A token price alone leaves out the system around the model; a global TWh projection leaves out the product denominator. Neither number should be substituted for telemetry the team has not collected.
Measure the complete service path
A user-visible feature may trigger retrieval, model inference, tool calls, validation, retries and a human correction. Product economics should follow that whole path to a successful outcome, not just the first model response. Teams can compare routes by cost and energy where measured, latency, task quality, exception rate and review time, then state which outcomes are counted.
This is why product constraints must be explicit. A fast, inexpensive response that fails the task may be worse value than a slower route that works; an expensive model may be justified for one high-value decision and wasteful for routine extraction. The comparison needs a shared task set and a documented success criterion rather than a provider name or benchmark score alone.
Route capability to the job
Routing work to a smaller model, a cached result or a specialised service can reduce unnecessary computation when those paths meet the same quality bar. More capable systems may be reserved for tasks where the difference is visible and valuable. This is an engineering hypothesis to test for each workload, not a universal claim that small models always use less energy or deliver equal results.
A route should also have a safe fallback when a provider is unavailable or a result is uncertain. Teams need to record how often work escalates, whether escalation improves the outcome, and what additional delay or review it creates. That evidence makes routing a product decision that can be revisited, rather than an optimisation assumed to be permanent.
Infrastructure conditions reach the interface
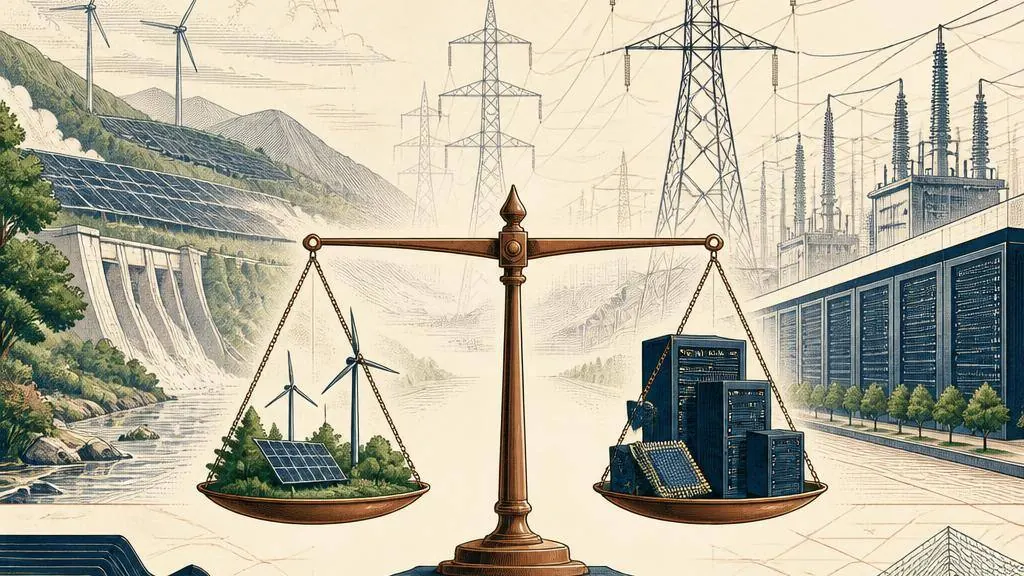
Electricity supply, cooling and grid connections affect where data centres can expand, while network distance and regional capacity influence latency and resilience. The IEA’s global projection does not say which facility will serve a given request, so it should not be used to claim a specific product is power-constrained. It does show why infrastructure planning belongs in product and service conversations. [1]
A product that promises quick responses during peaks needs a plan for capacity variation, retries and regional failure. That plan can include queued work, smaller fallback models, cached results or clear user messaging. The choice depends on the task and user expectation; the global energy forecast is context, not a substitute for service measurements.
Compete on cost and reliability, not only capability
Stanford HAI’s 2026 AI Index describes competitive pressure moving beyond headline model capability toward cost, reliability and domain-specific performance. That framing supports a product-level question: how much capability does this task need, and what does the whole route cost to deliver a correct result? It does not supply a universal cost curve or energy figure for specific products. [2]
For a product owner, the useful unit is a successful outcome at an acceptable service level. Track the model and tool configuration, task quality, retries, latency, cost and human interventions. Where energy is measured, document the measurement boundary and include failed work. Where energy is unavailable, say so rather than converting global data-centre demand into a per-request estimate.
A budget does not require teams to choose the weakest model. It helps reserve higher-cost capability for tasks where evaluation shows a meaningful quality improvement. If the added capability does not change success, risk or user experience, a simpler route may be more appropriate. If it does, the team can document why the cost is justified and how exceptions are handled.
The defensible conclusion is that data-centre electricity demand is forecast to more than double between 2024 and 2030, while AI is a leading contributor to that growth. That system-wide outlook raises the importance of efficiency and infrastructure planning, but it does not quantify the energy of an individual AI feature. Product teams still need measured workload data. [1]
Treat the energy forecast as a reason to ask better design questions, not as a product-level answer. Measure successful work, compare routes under a consistent test, and disclose what the system cannot currently report. That keeps claims proportional to evidence while leaving room to improve the service.
Intelligence becomes a design constraint when capability, energy, latency and reliability are measured together. The measurements should be specific to the workload and should distinguish global forecasts from observed product behaviour.
That evidence can help a team decide where to spend compute, when to ask a person for help and which features need a different service design before they scale.
The practical goal is not simply to use less compute; it is to make the relationship between resources and useful outcomes visible.
What to do with this
Product teams should report task-level quality, retries, latency and cost, and state clearly where energy is not measured.
Sources
- International Energy Agency, Energy and AI: Executive Summary. https://www.iea.org/reports/energy-and-ai/executive-summary
- Stanford Institute for Human-Centered AI, AI Index Report 2026. https://hai.stanford.edu/ai-index/2026-ai-index-report
Methodology note
This article was first published in September–October 2026 and has been updated with a new headline and summary. Claims are attributed to the sources listed above. See our editorial policy for how we source, review and correct our reporting.

Global AI News Desk explains AI news using primary sources: filings, official documents, papers and company announcements. Claims made by companies are attributed to them. Spotted an error? Tell us — we correct mistakes openly under our editorial policy.